
If you shudder a little when you hear the acronym “KPI”, you’re in good company. For many marketers and salespeople, those three little letters are an ill omen.
Sales KPIs are important. But only when they truly help drive revenue. You’re already gasping for air in a rising tide of data. And you’re not going to hit your growth and revenue goals with unnecessary additions to your crowded analytics dashboard.
We get it. That’s why we’ve got a zero-tolerance approach to vanity metrics that exist solely to fill out largely meaningless performance reports.
We’ll cover KPIs that actually generate sales growth and align with your business goals. Crucially, we’ll explain why they’re important and how they can help you and your team make better decisions.
Let’s get to it.
Why B2B Sales KPIs Matter
Key performance indicators are important because they set your company’s direction for growth. They’re the bedrock on which you define goals, measure progress, align your team's strategic activities, and make critical business decisions.
KPIs are not performance targets themselves. Rather, they’re the metrics used to label your targets and measure progress towards them. The target is the specific goal you're aiming for while the associated KPI tells you if you’re on track to achieve it.
For example, you set a target of achieving a 20% lead-to-customer conversion rate by the end of Q4. In this case, 20% by the end of Q4 is the target while lead-to-customer conversions is the KPI.

You might be wondering what the difference between KPIs and other metrics is. The clue is in the word “key.” KPIs are metrics considered fundamental to the success and high-level goals of your business.
Many other metrics focus on tactical and operational processes. For example, your website bounce rate or email open rate are both important metrics, but they’re not key indicators of your company’s overall health.
Tracking KPIs gives you a basis for identifying strengths and weaknesses in your strategic approach to growth and determining whether or not your goals are realistic. You can use this understanding to make data-backed decisions likely to lead to improvements.
In addition, sales KPIs are incredibly useful for fostering accountability and motivation in your sales team. Nothing energizes a sales time like KPIs on track to meet targets. Equally, subpar performance creates a clear context for identifying areas of weakness and inefficiency.
12 Important B2B Sales KPIs to Track
1. Sales Activity and Outreach

Definition: Activity KPIs measure the number of actions a sales team makes in a particular area, such as volume of cold calls dialed or email follow-ups sent. They contrast with sales performance metrics because they do not track specific outcomes.
Why it matters: While sales activity and outreach KPIs don’t measure performance directly, they’re still important because they indicate the overall efficiency of a sales team and act as a basis for setting realistic performance goals. When you know how many actions your sales team is completing, you can better determine appropriate outcomes. “Increase cold sales calls in America and Canada by 20% over 12 months” is an example of a goal based on an activity KPI.
Examples: Cold emails sent, calls dialed, demos given, meetings booked, and proposals generated.
Measuring sales activities can quickly become confusing. One way of staying organized is to use an AI sales development representative (SDR) to ensure all activity is logged and available in a single place.
Artisan has an AI SDR called Ava, and she can track all sales activity within the platform. Get in touch today to see how Ava can help you track all your key sales activities with practically no manual input.
2. Sales-Qualified Leads by Source
Definition: Sales-qualified leads by source measures the volume of interested leads that come from specific sales and marketing channels.
Why it matters: Tracking new sales-qualified leads by source tells you which of your marketing channels is most effective at generating high-quality leads. Some channels will provide large volumes of low-quality leads while others will generate low volumes of high-quality leads. By measuring sales-qualified leads—leads who have moved some way down your sales funnel and are likely to buy—you can identify those channels that effectively drive both quantity and quality and leverage them further.
Examples: Track the volume of sales-qualified leads by source across all your channels: email marketing, social media, search engine traffic, paid online and offline advertising, referrals, affiliate marketing, events and joint ventures.
3. Average Lead Response Time (Speed to Lead)
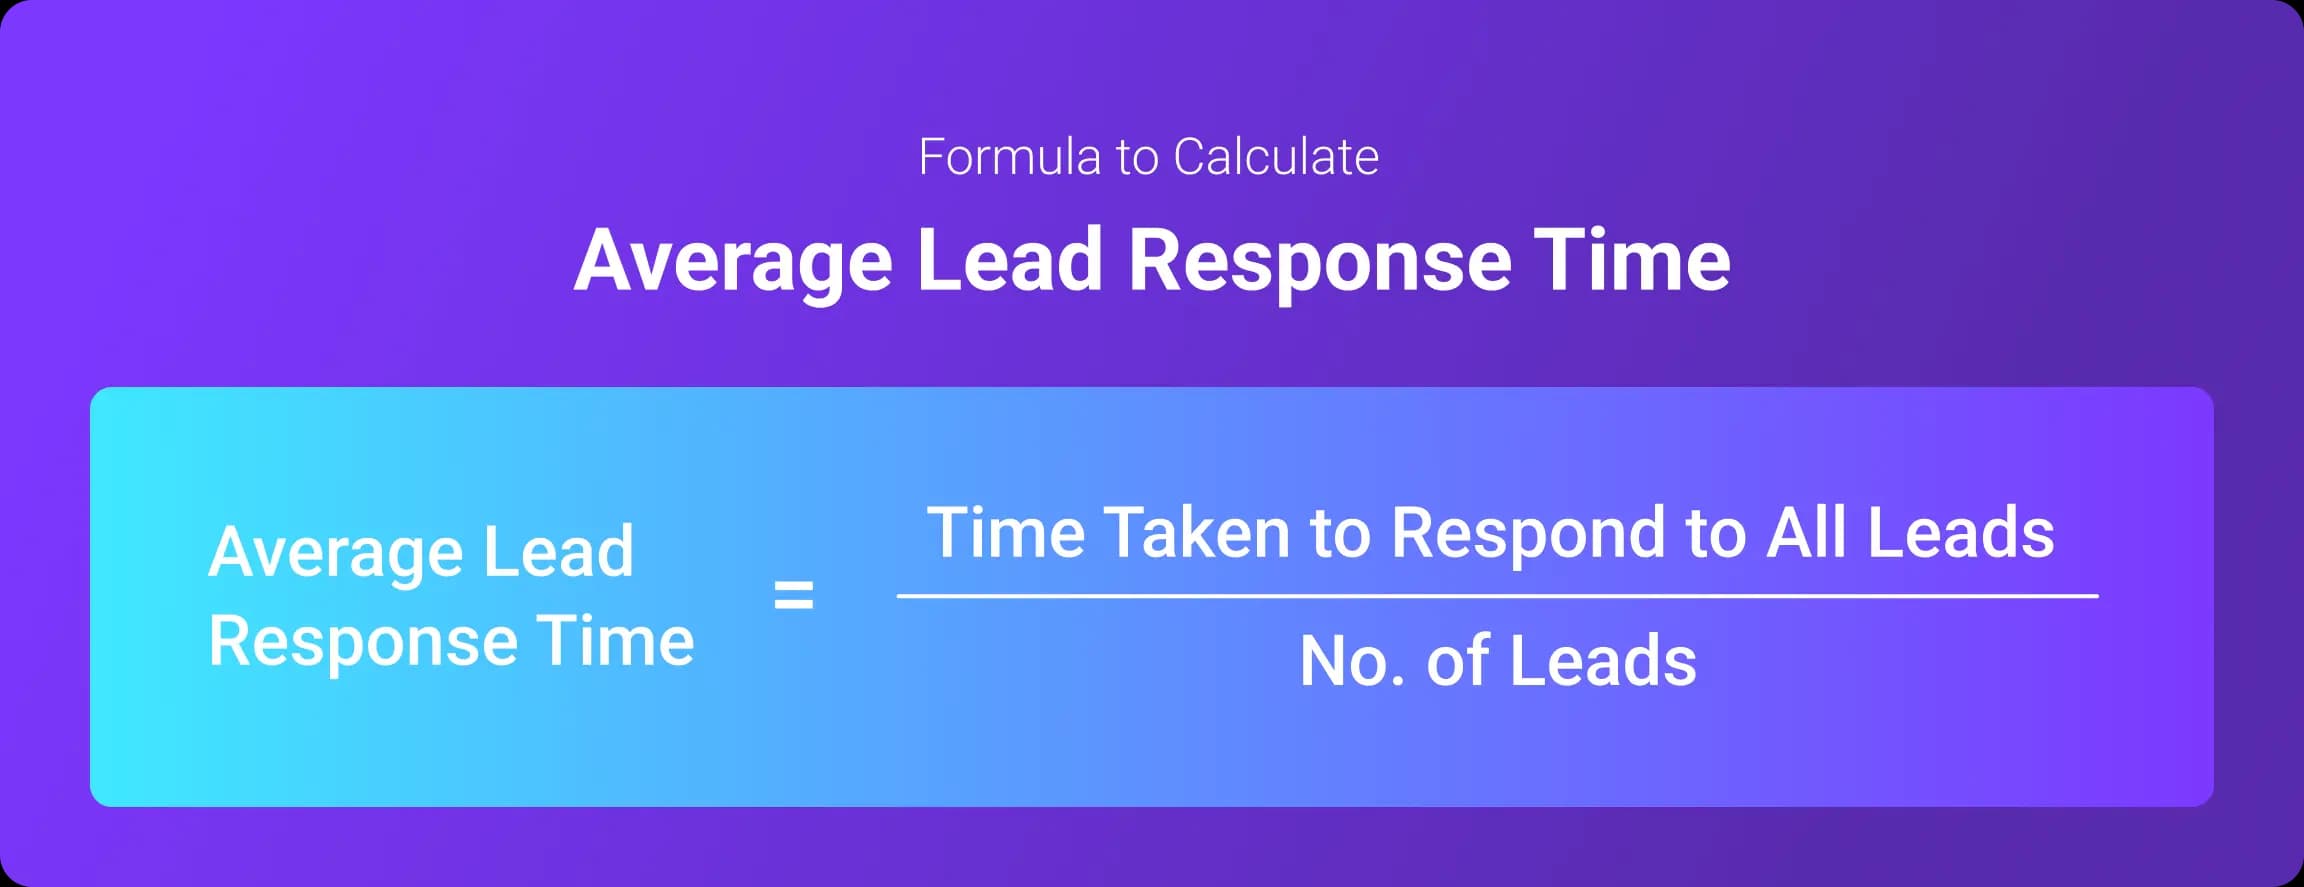
Definition: Your average lead response time (also called speed to lead) measures the average time it takes you to respond to a lead once they’ve contacted your company (by filling out a web form or ending an enquiry email, for example).
Why it matters: The faster you can reach out to leads, the more likely they are to convert. Forbes reports that you’re 100 times more likely to successfully contact a lead if you follow up in under five minutes. If you can reduce your average lead response time, you’ll see gains across other baseline KPIs like sales and revenue.
Formula: Average lead response time = Total time taken to respond to leads / Number of leads
4. Marketing Qualified Leads (MQL) to Sales Qualified Leads (SQL) Conversion Rate
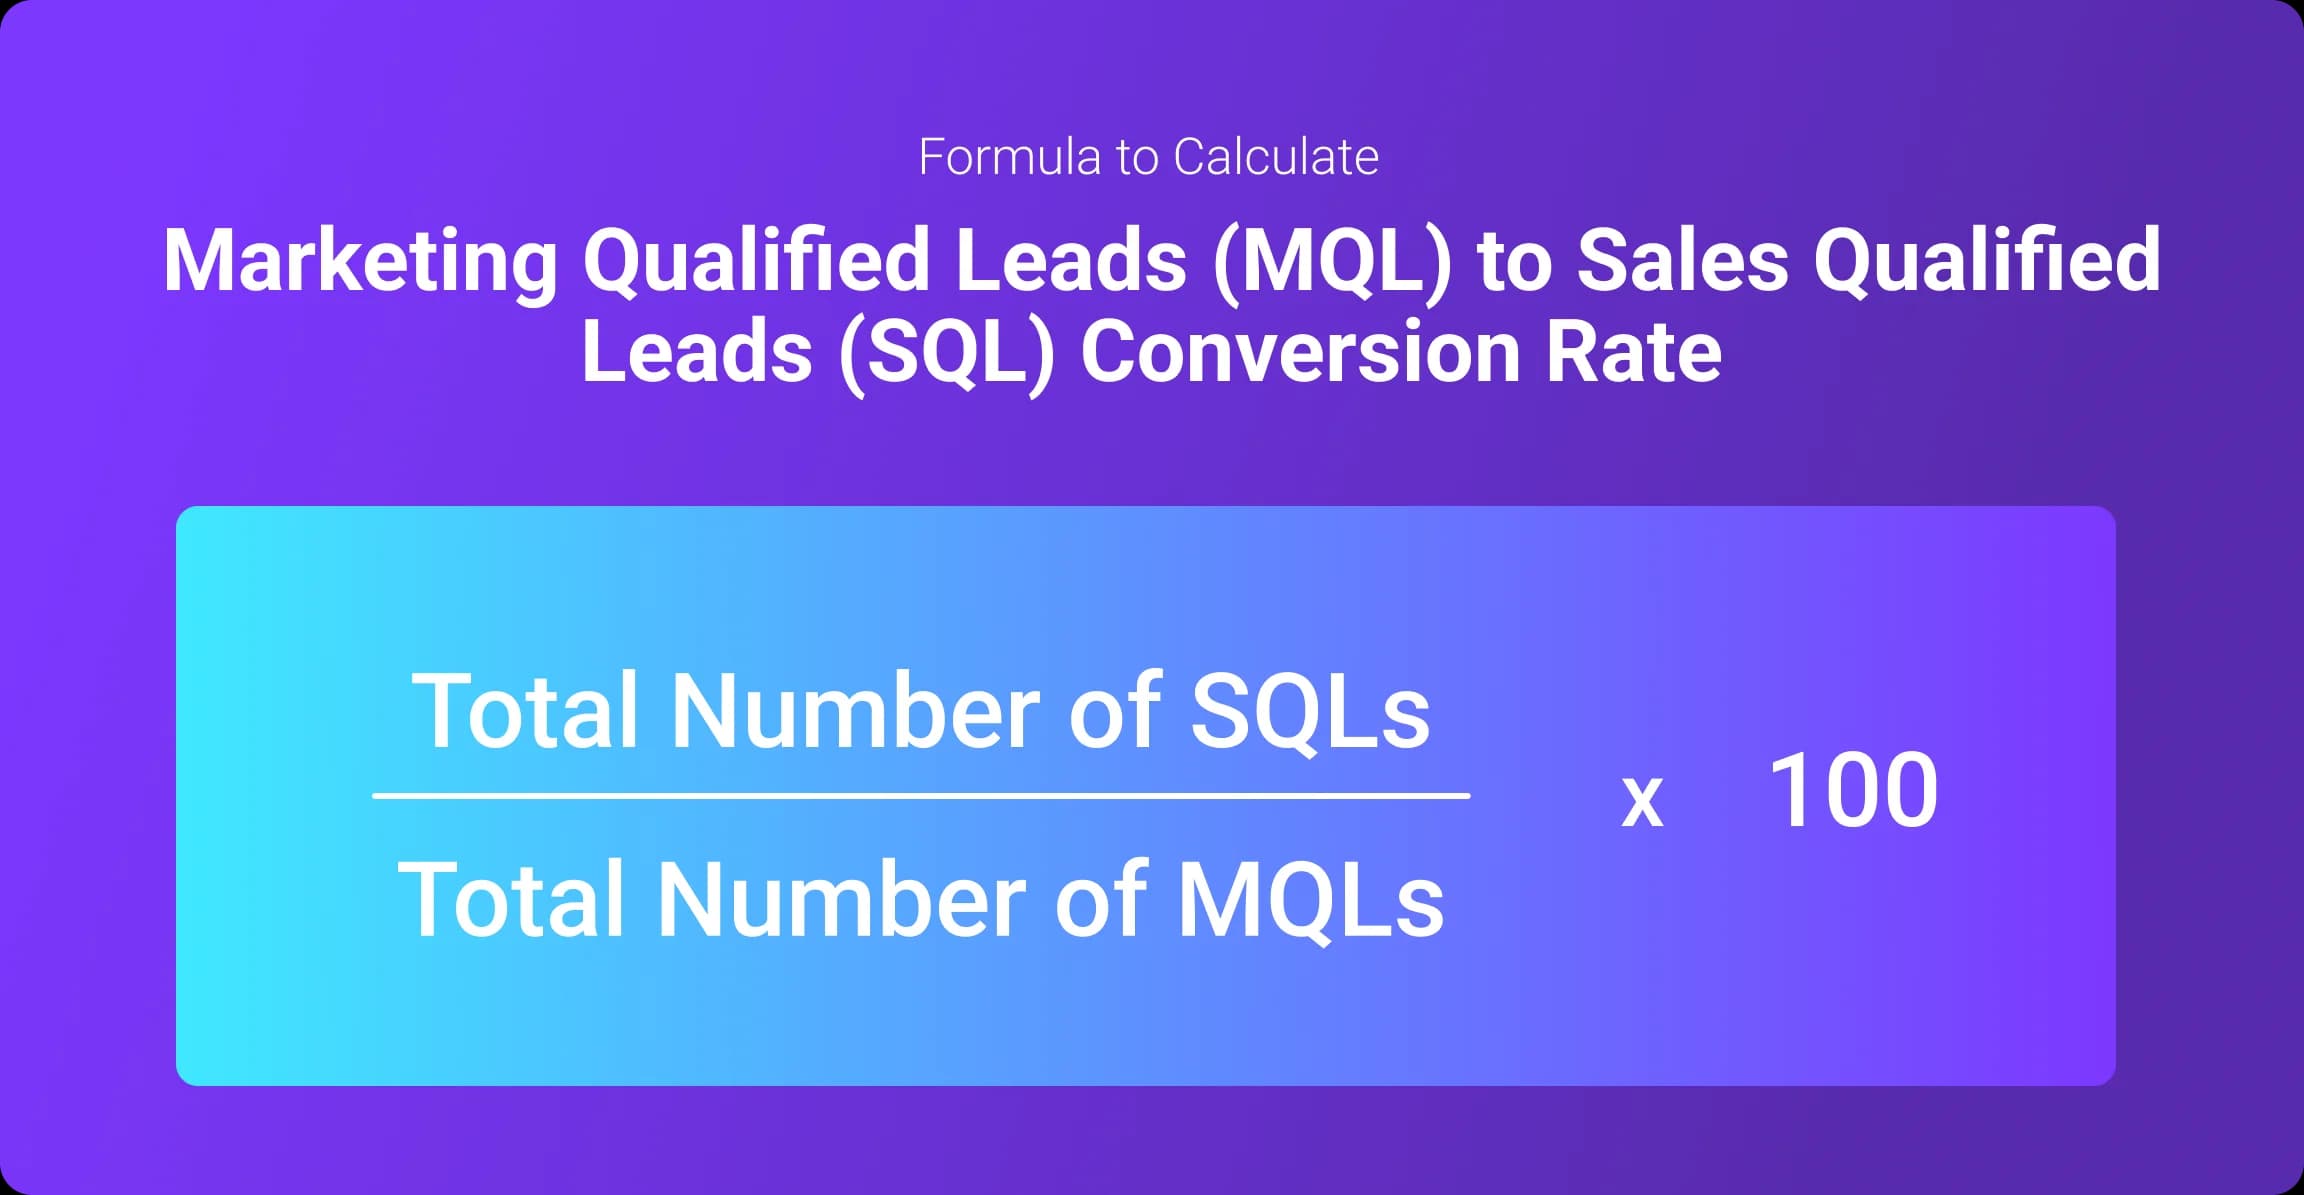
Definition: Your MQL-to-SQL rate measures the percentage of leads transitioning from marketing-qualified leads to sales-qualified leads.
Why it matters: Sales teams use different lead-scoring methods to define MQLs and SQLs. However, in all cases the distinction points to levels of interest. An MQL has shown enough interest in your company to be considered likely to buy. An SQL has moved through part of your sales funnel and is considered highly likely to buy. Your MQL-to-SQL strategy indicates the efficacy of your lead nurturing process. A low percentage may point to the fact that your sales team is not engaging adequately with leads generated and their approach needs improving.
Formula: Marketing-qualified leads (MQL) to sales-qualified leads (SQL) conversion rate = (Total Number of SQLs / Total number of MQLs) x 100
5. Qualified Lead to Customer Conversion Rate (Sales Close Rate)
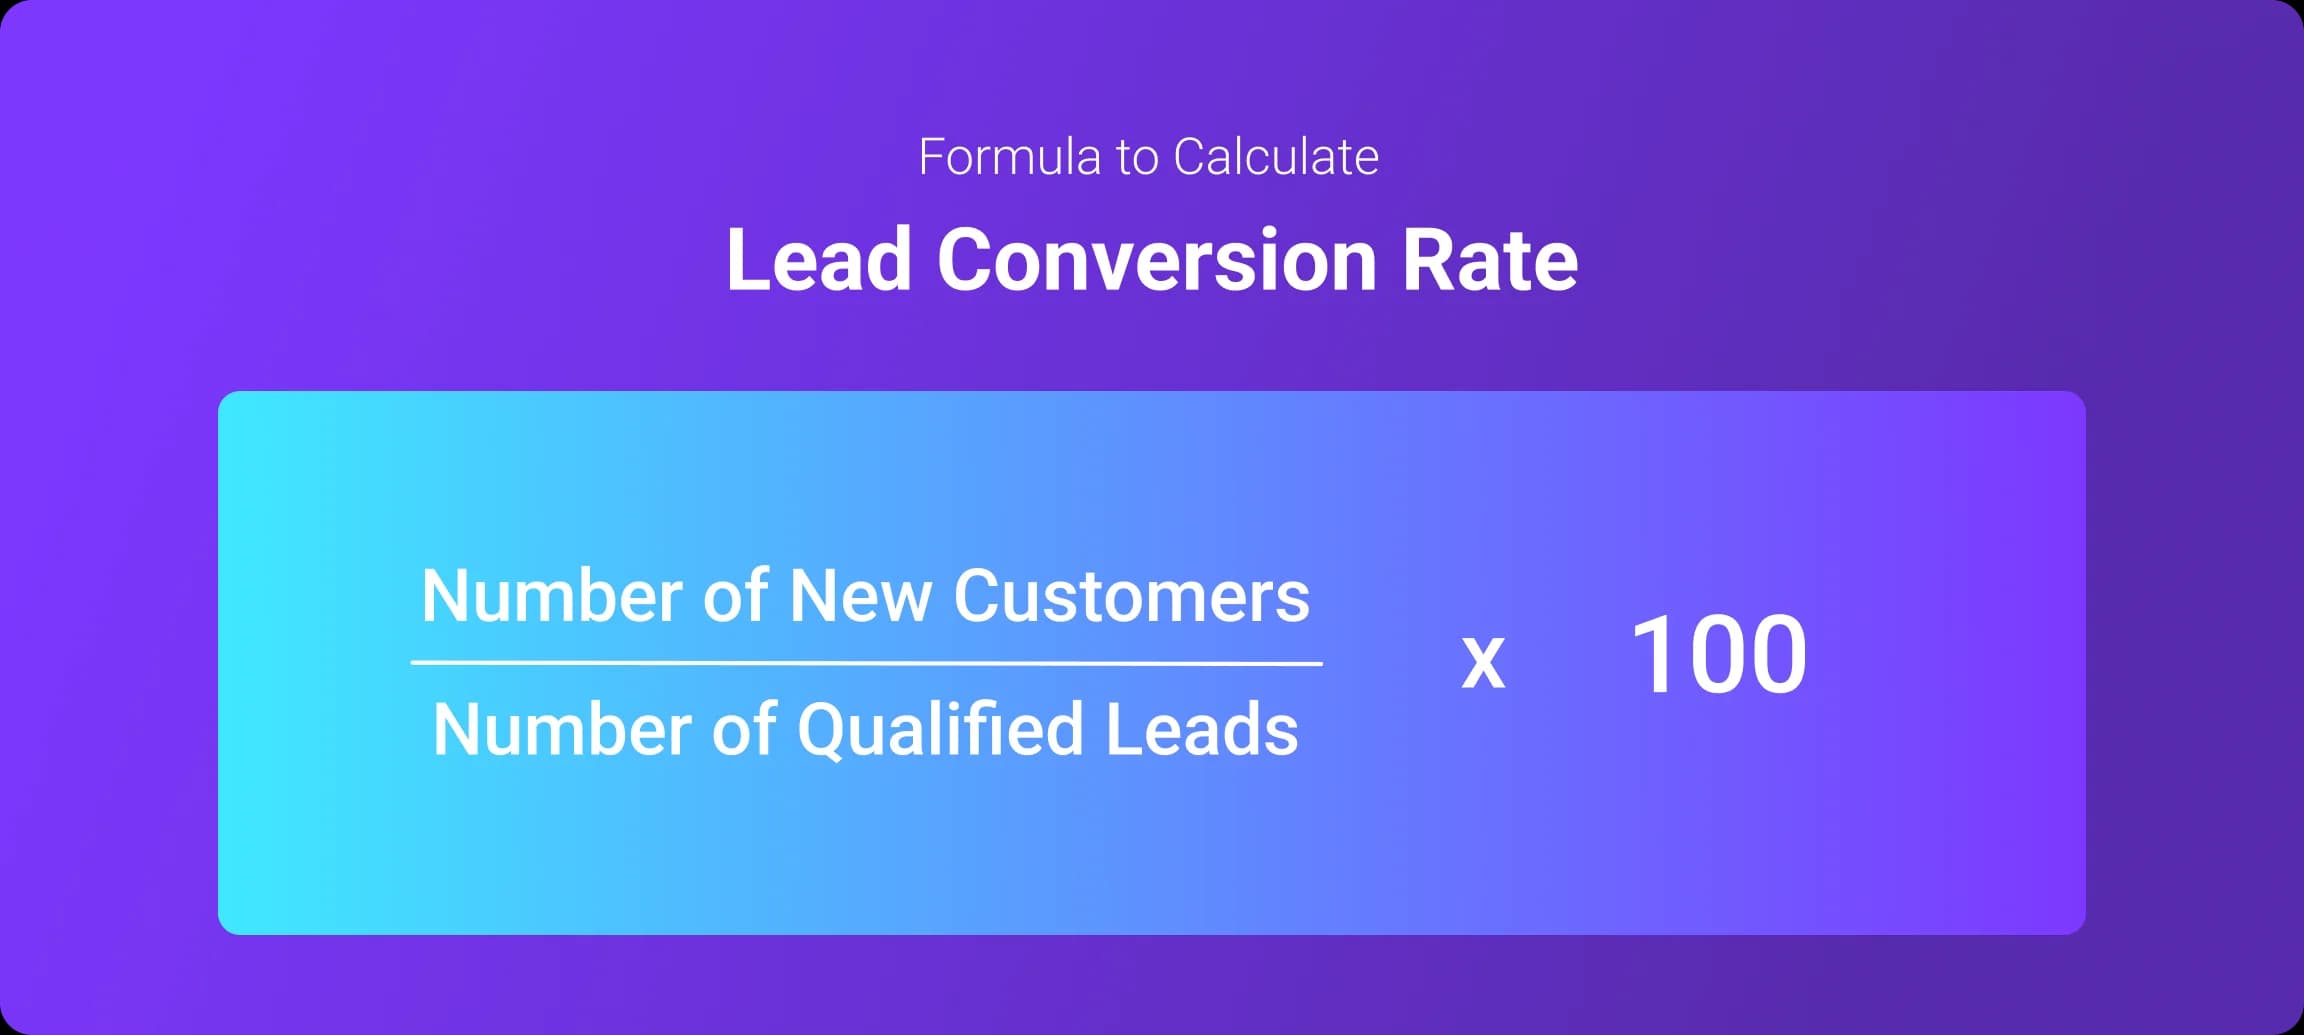
Definition: Your lead to customer conversion rate measures how many of your qualified leads are converting to customers. Unlike your MQL-to-SQL rate, it tracks the performance of your whole sales funnel, from early stage marketing to the moment a lead signs on the dotted line (or hits that “Pay Now” button).
Why it matters: Your lead to customer conversion rate measures the success of your sales funnel at a very high level. Unlike more specific KPIs that measure individual stages of your funnel, your lead conversion rate gives an overall indicator of the health of your “engine.” Boosting your lead conversion rate will directly impact your revenue and profitability. Qualified leads in this sense encompass both marketing and sales qualified leads.
Formula: Lead conversion rate = (Number of new customers / Number of qualified leads) x 100
One of the best ways of increasing your lead conversion rate is to use detailed ideal customer profiles (ICPs) based on up-to-date data.
Artisan’s AI SDR Ava has a database of over 300 million potential leads from which she can target your ICP, all on autopilot. Get in touch now to see how Artisan can help you meet your sales targets.
6. Sales Win Rate (Closed-Won Opportunities)
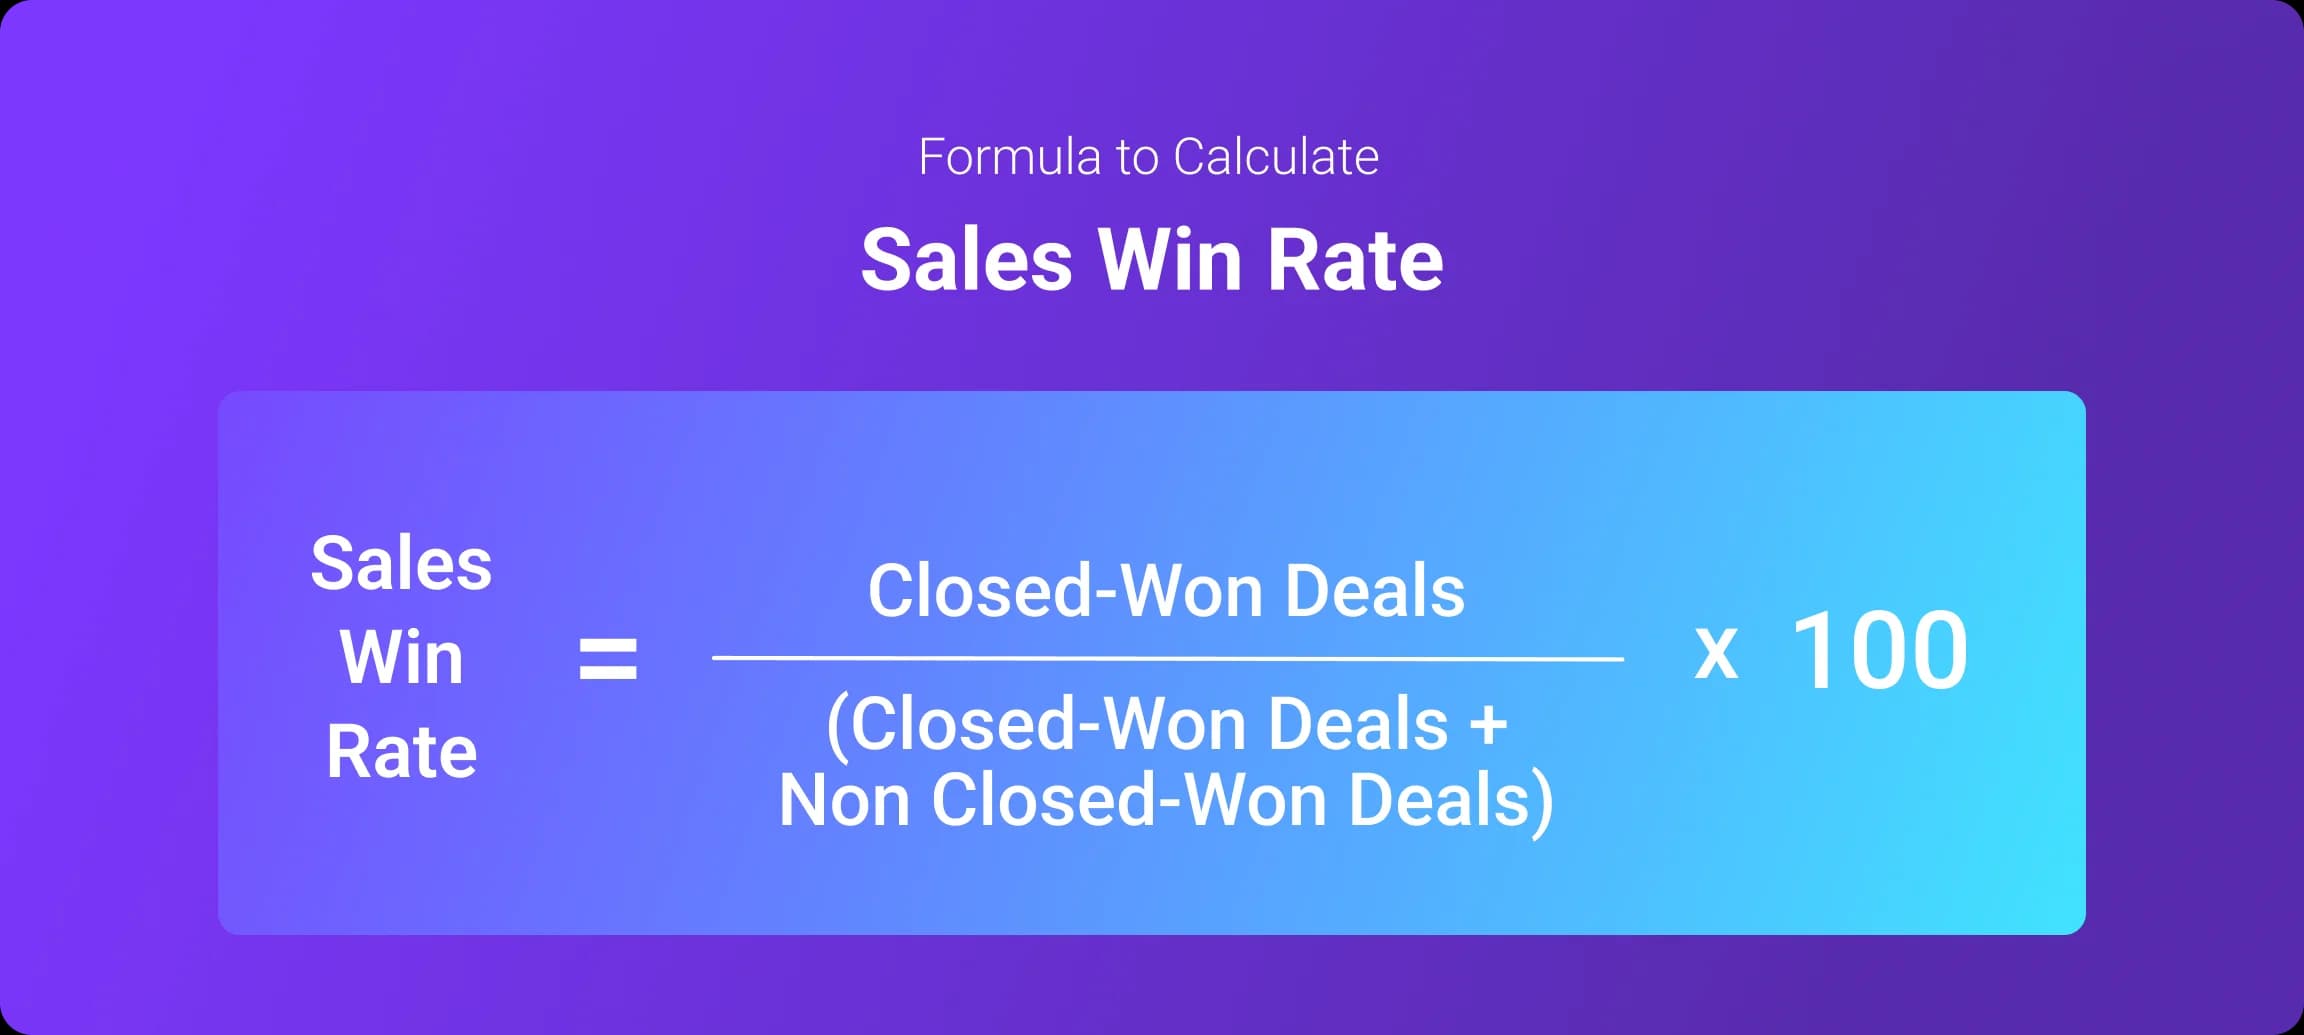
Definition: Your sales win rate measures your closed won opportunities against all closed opportunities (closed won opportunities and closed opportunities that didn’t result in a sale).
Why it matters: Your sales win rate shows you how many leads have converted to customers out of all leads who have completed the sales cycle. Closed-lost leads have given a definite “no” to your offer or been deemed inactive. This KPI is different to your lead to customer conversion rate or sales close rate because it illustrates how well your sales team is converting leads they’ve actively engaged with into customers. A poor month-by-month lead to customer conversion rate and a high sales win rate may indicate that your sales team is struggling to connect with all leads and many are remaining as open opportunities.
Formula: Win rate = (Closed-won leads / (Closed-won leads + closed-lost leads)) x 100
7. Customer Acquisition Cost (CAC)
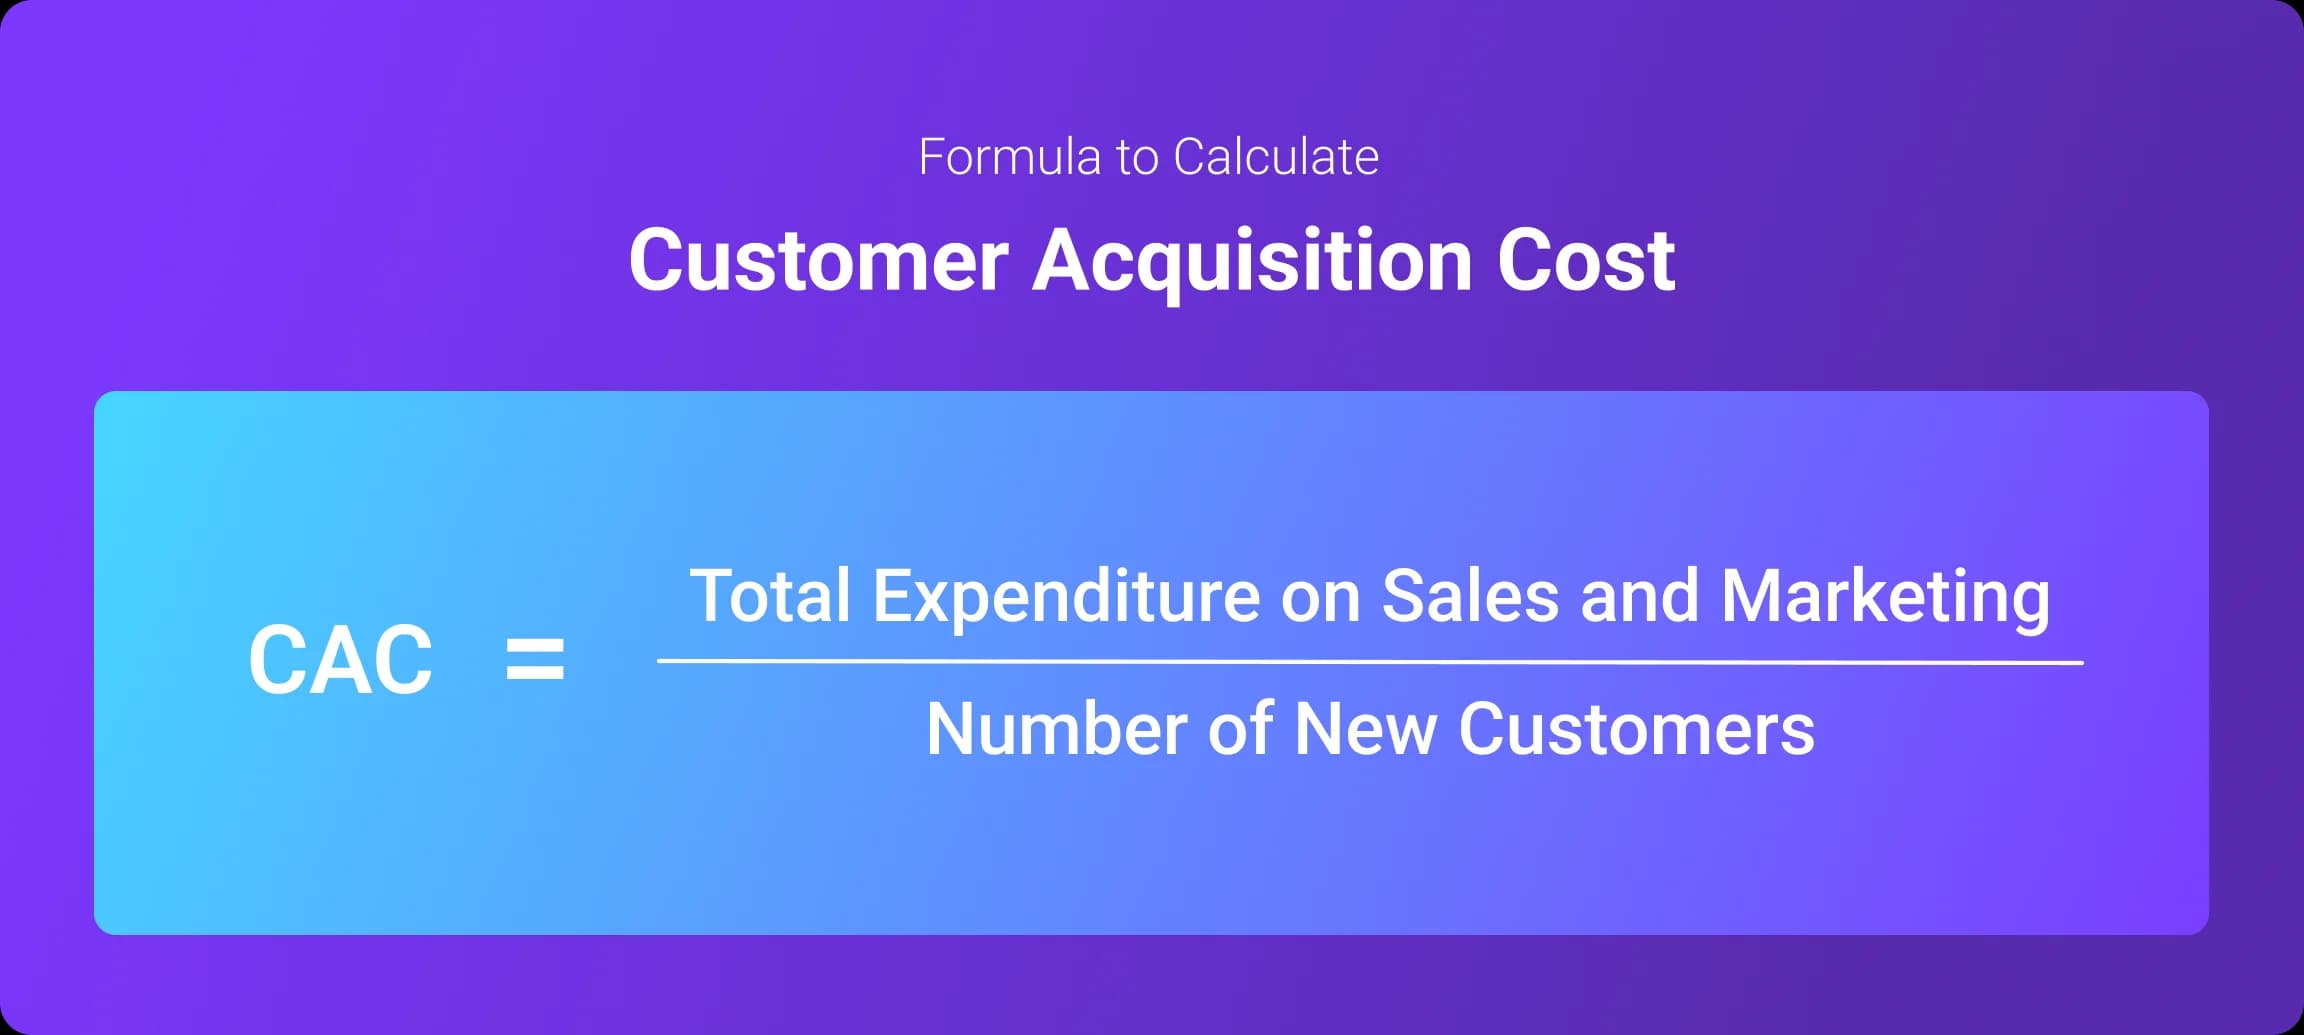
Definition: Your customer acquisition cost tells you how much it costs to gain a new customer.
Why it matters: Reducing your customer acquisition cost increases revenue. If the cost of acquiring a customer is reducing over time, it indicates that your marketing and sales team are becoming more efficient, either because of streamlined processes, more effective sales techniques, or the identification of appropriate marketing channels.
Formula: Customer acquisition cost = Total expenditure on sales and marketing / Number of new customers
8. Pipeline Velocity
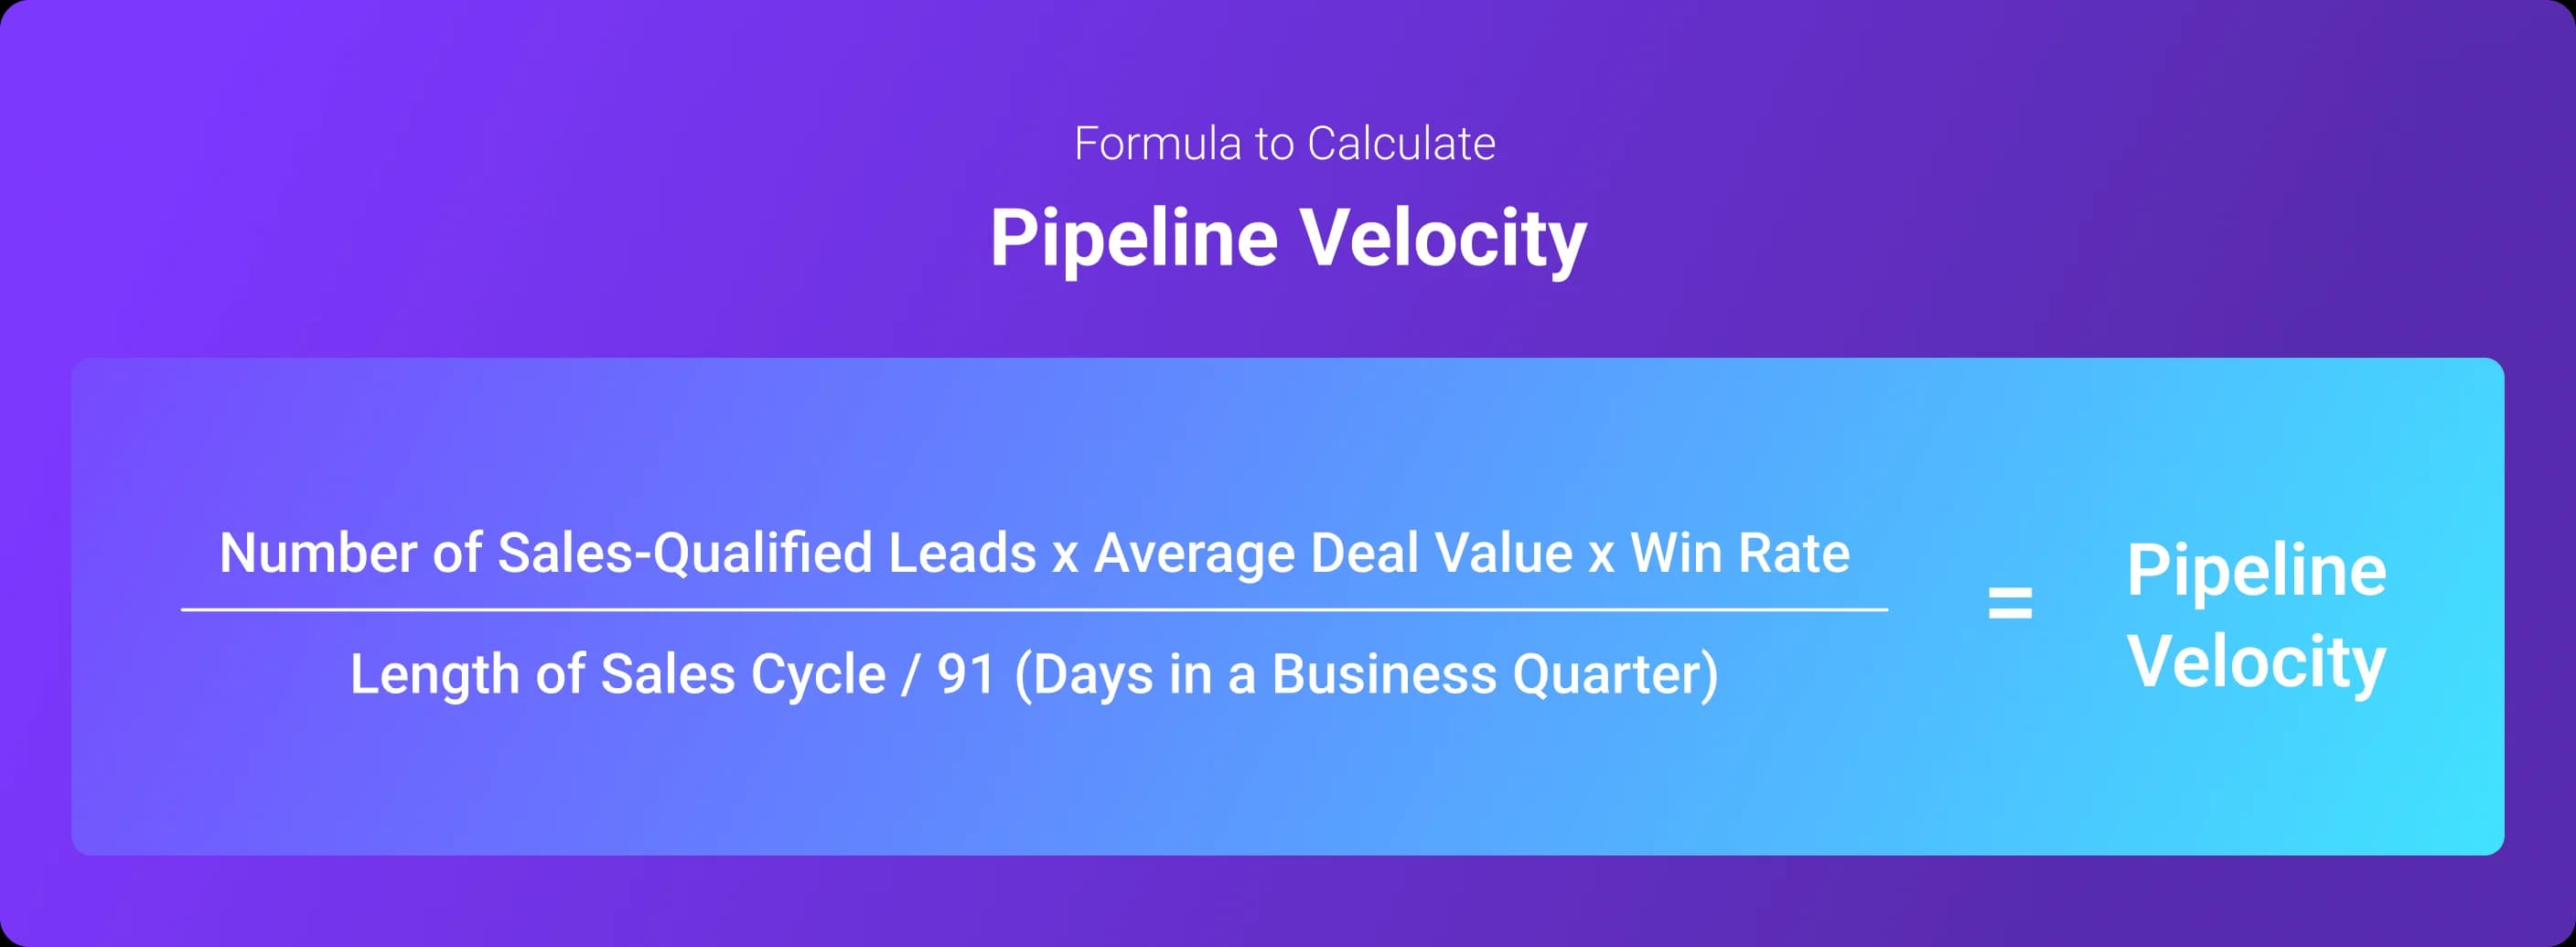
Definition: Your pipeline velocity, also called sales velocity, measures the speed at which sales-qualified leads become customers. It’s calculated as revenue per quarter—for example, $100,000/quarter, which represents $100,000 in closed deals over a quarter.
Why it matters: Pipeline velocity measures the efficiency of your later-stage sales funnel and allows you to make revenue forecasts. A low Pipeline velocity may suggest that your sales team is experiencing operational difficulties or their sales techniques could be improved. A higher pipeline velocity means a better return on investment (ROI) for your sales budget.
Formula: Pipeline velocity = (Number of sales-qualified leads x average deal value x win rate) / (Length of sales cycle / 91 (days in a business quarter))
9. Customer Retention
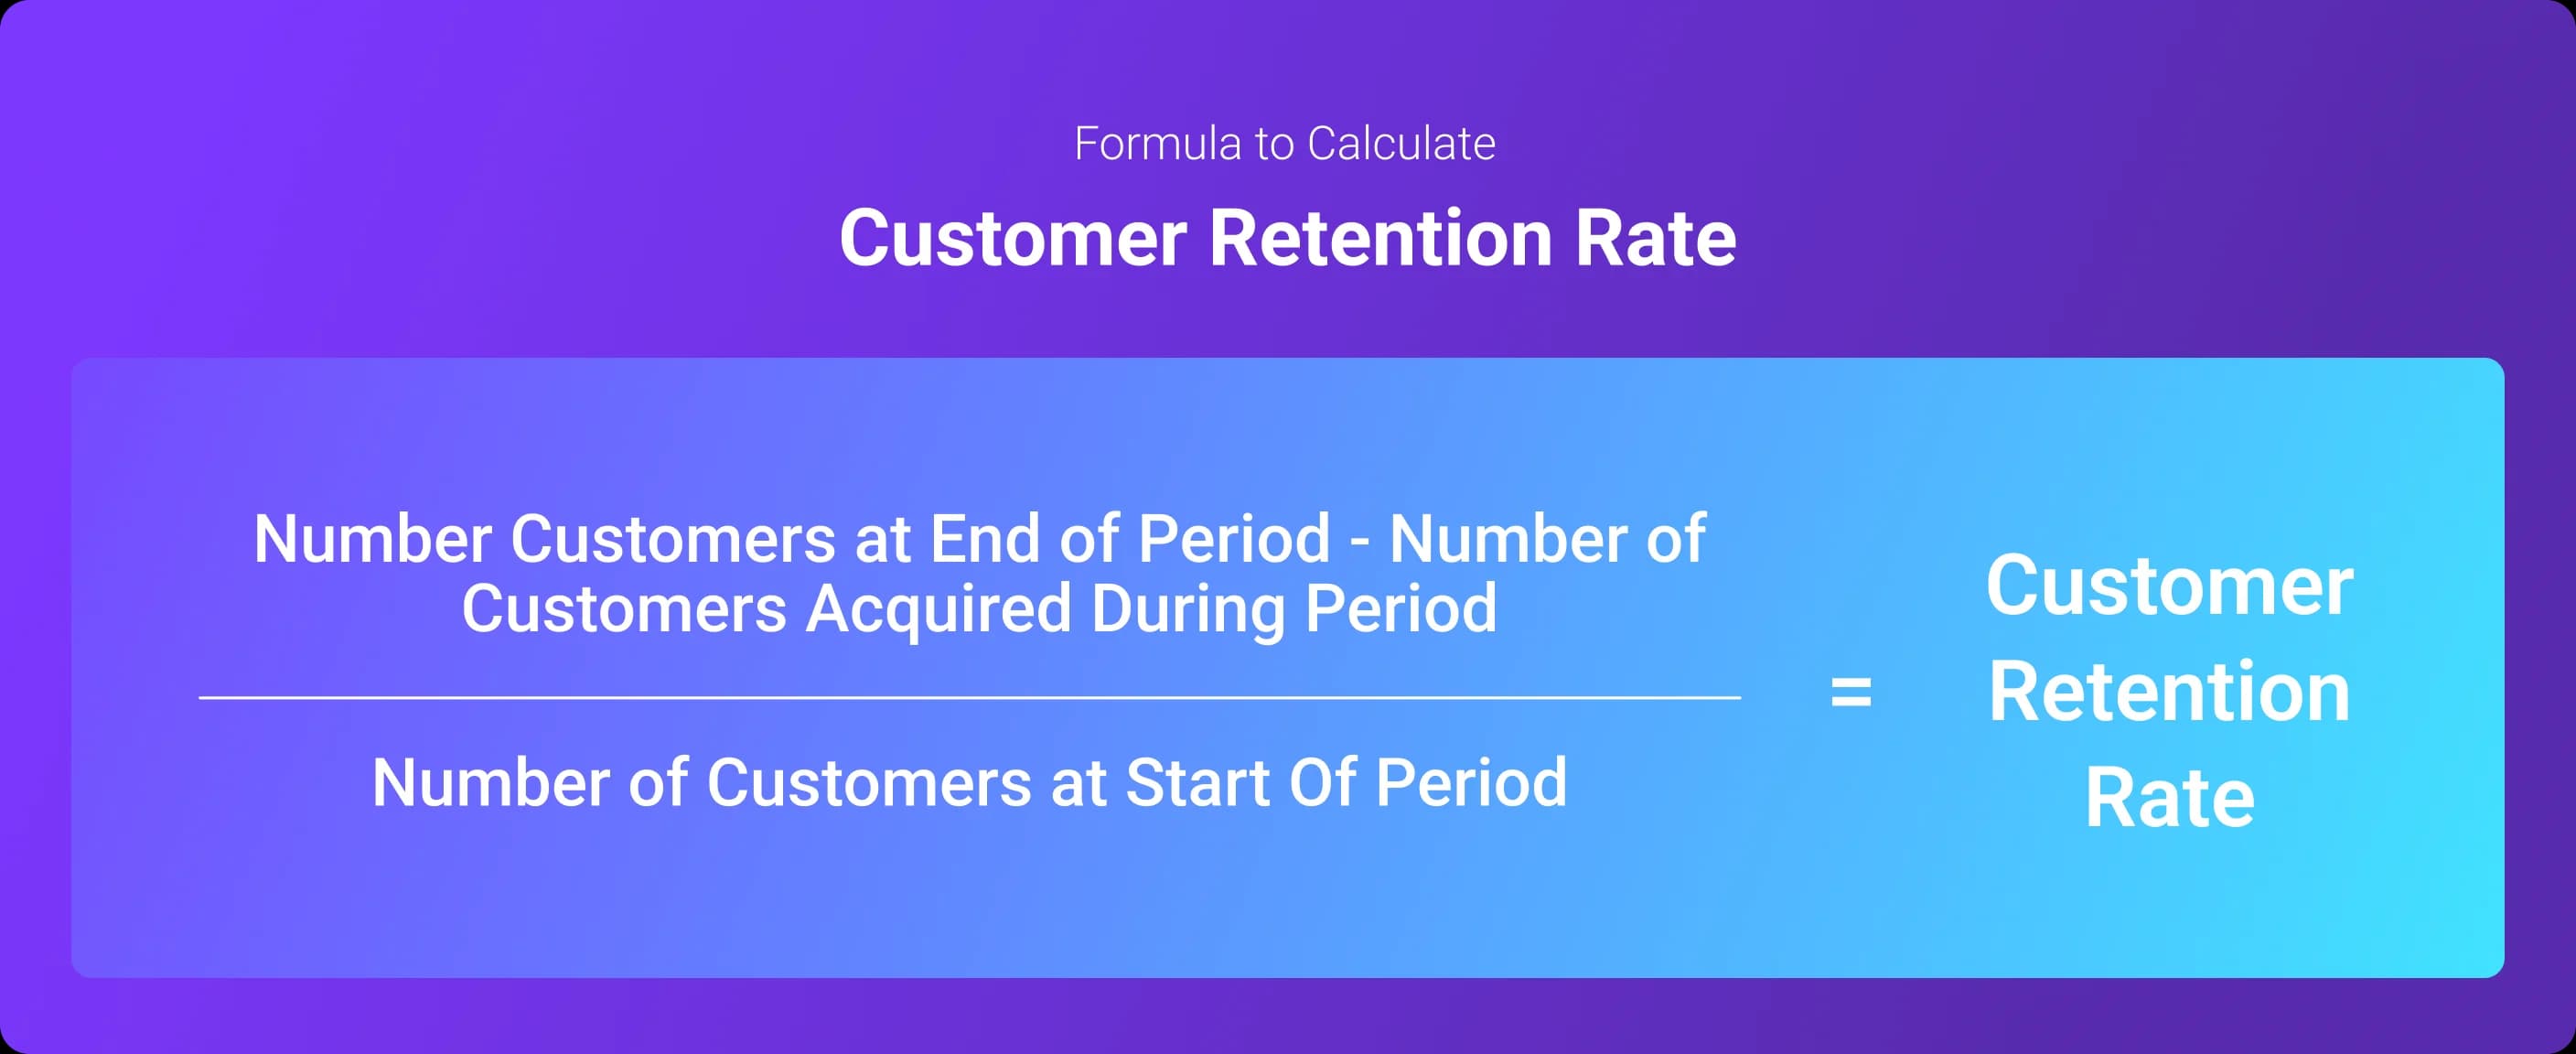
Definition: Your customer retention rate measures the percentage of customers who stay with you over a given period. It’s closely related to churn rate, which measures the number of customers who leave over the same period.
Why it matters: Your ability to hold onto customers directly impacts your revenue. It costs four to five times as much to acquire a new customer than retain an existing one. In essence, a high customer retention rate means that your customers are happy and you are effectively building loyalty and long-term satisfaction. This also creates upsell and cross-selling opportunities for you.
Formula: Customer retention rate = (Number customers at end of period - number of customers acquired during period) / Number of customers at start of period
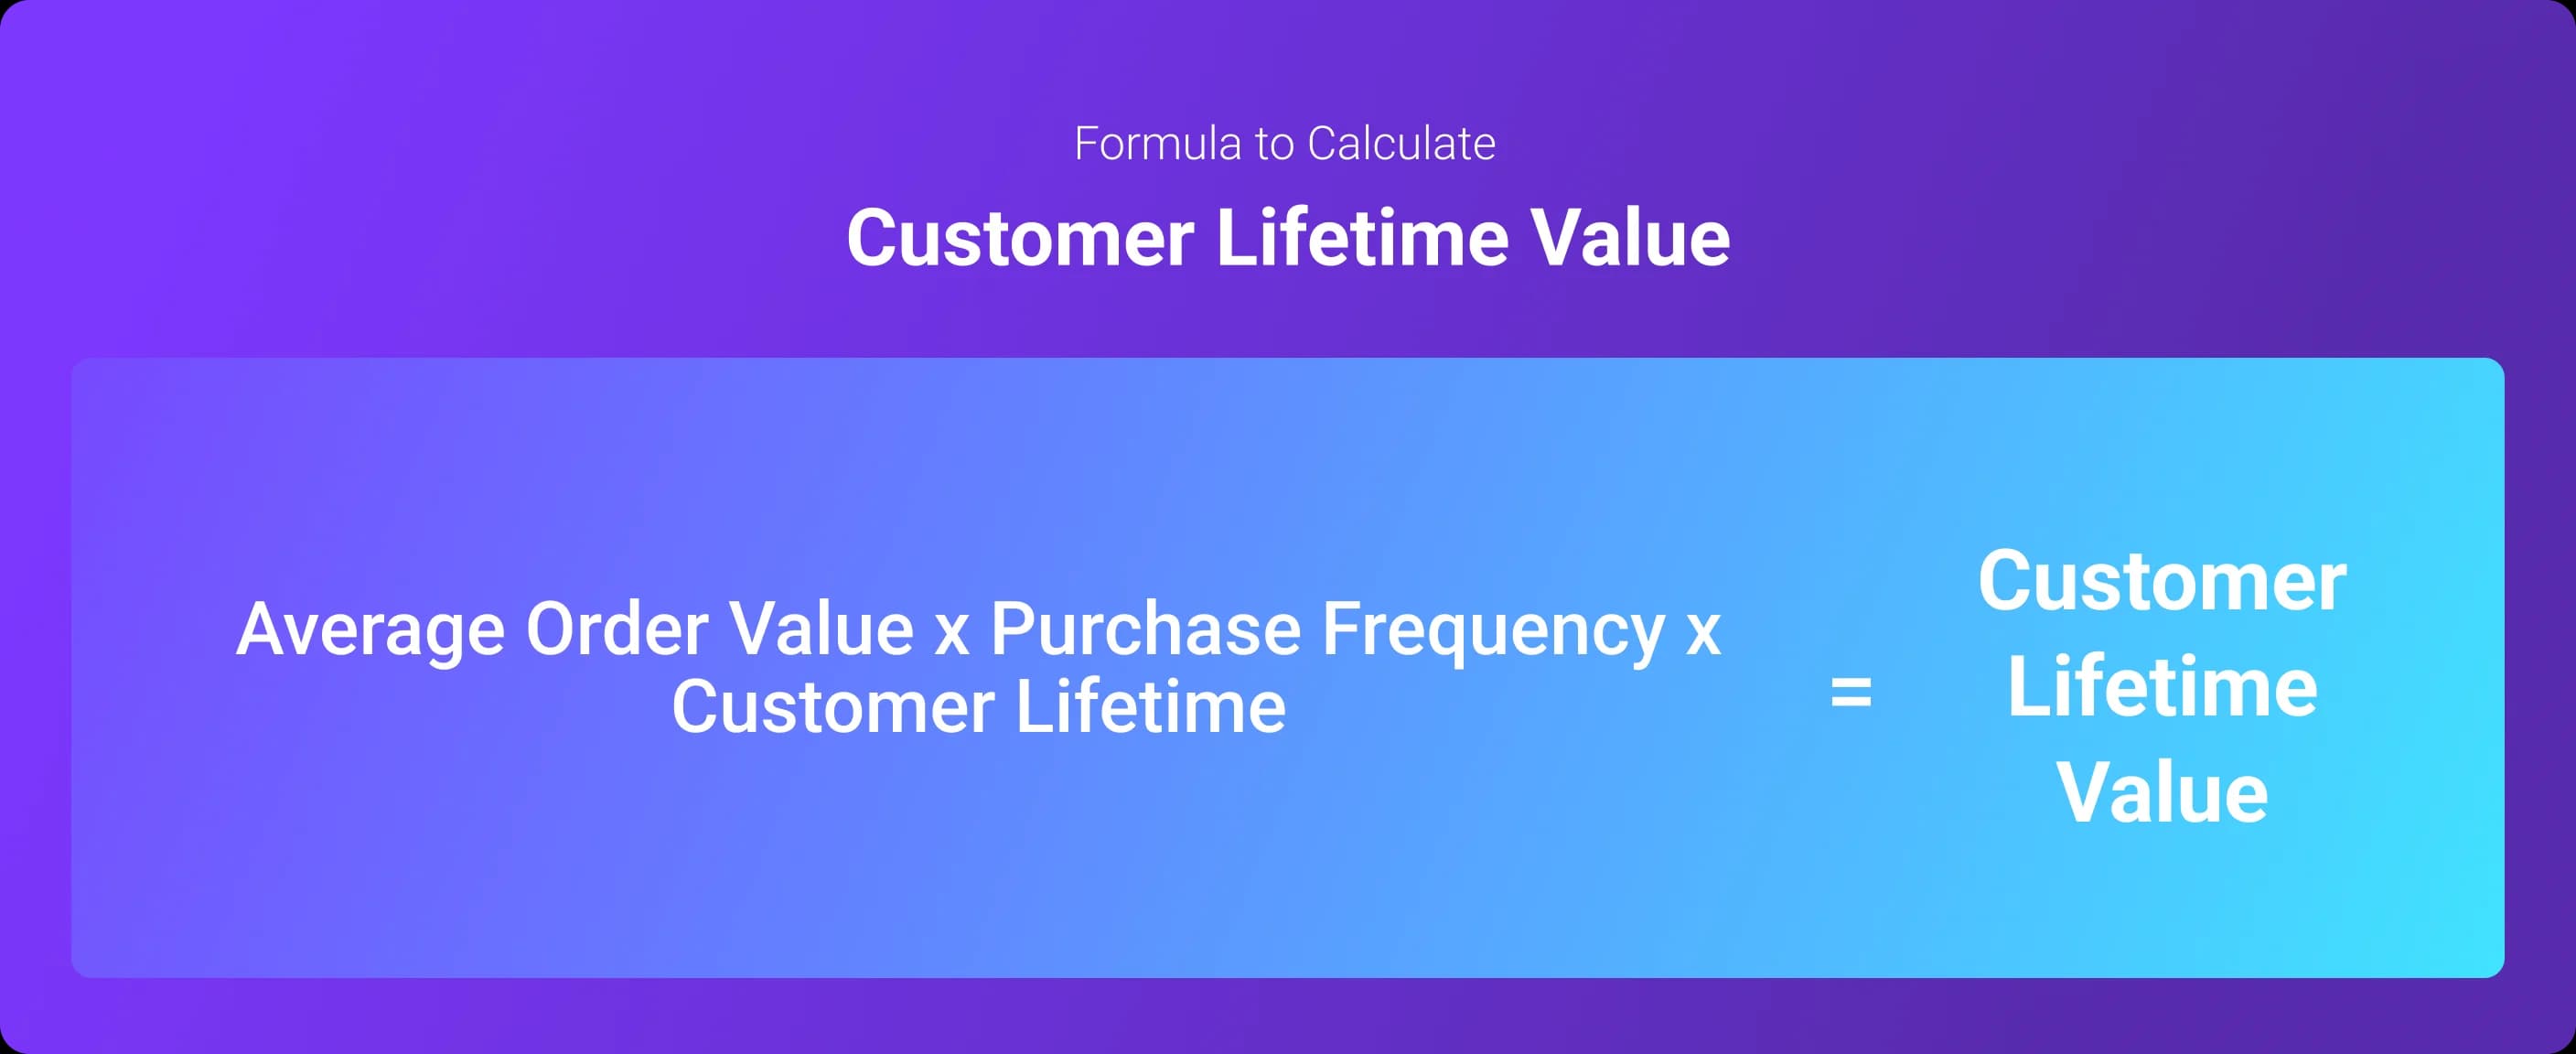
10. Customer Lifetime Value (CLV)
Definition: Customer lifetime value measures the amount of money a customer will spend with you over their lifetime. This can be quite a tricky KPI to calculate because you need enough data to accurately determine the average length of time a customer remains active in addition to their order value and purchase frequency.
Why it matters: Customer lifetime value tracks three important sales metrics in combination: the average time a customer remains active, how often they make a purchase, and the average value of the purchases they make. It’s a full snapshot of the value of your typical customer. If it’s increasing, it means that you’re providing value, building strong customer relationships, and driving up your average deal size.
Formula: Customer lifetime value = Average order value x Purchase frequency x Customer Lifetime
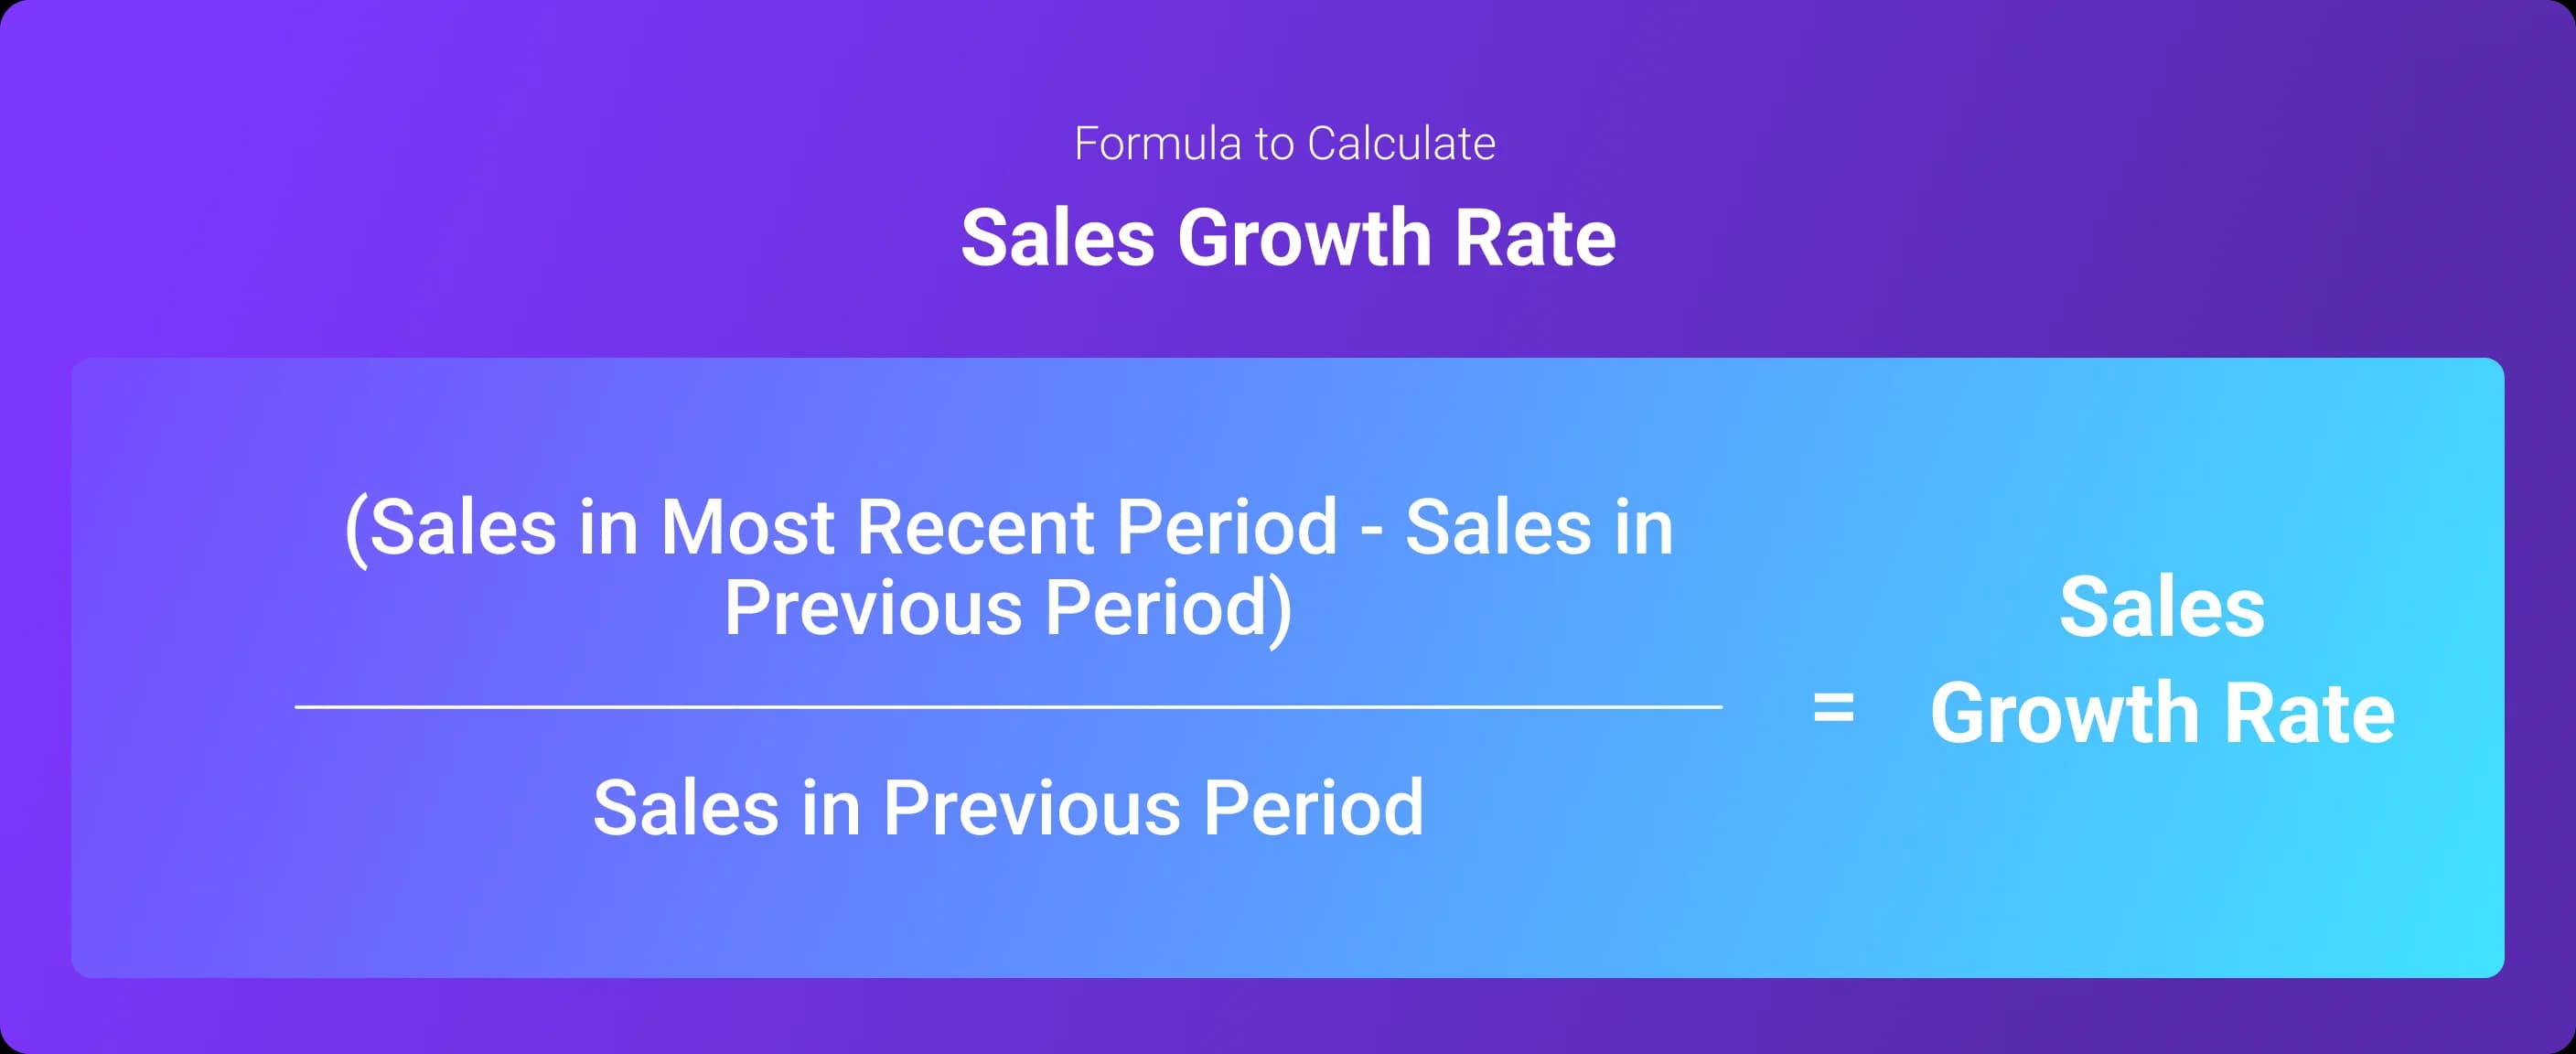
11. Sales Growth Rate
Definition: Your sales growth rate measures the volume of sales in your most recent period compared with the previous period. It’s one of the most important growth metrics for a company.
Why it matters: Your sales growth rate is one of the strongest—if not the strongest—measure of your company’s overall growth. If you’re seeing a steady rise in sales growth, it is likely that your sales team is becoming more efficient, the number of deals is increasing, and marketing efforts are going well.
Formula: Sales growth rate = ((Sales in most recent period - Sales in previous period) / Sales in the previous period) x 100
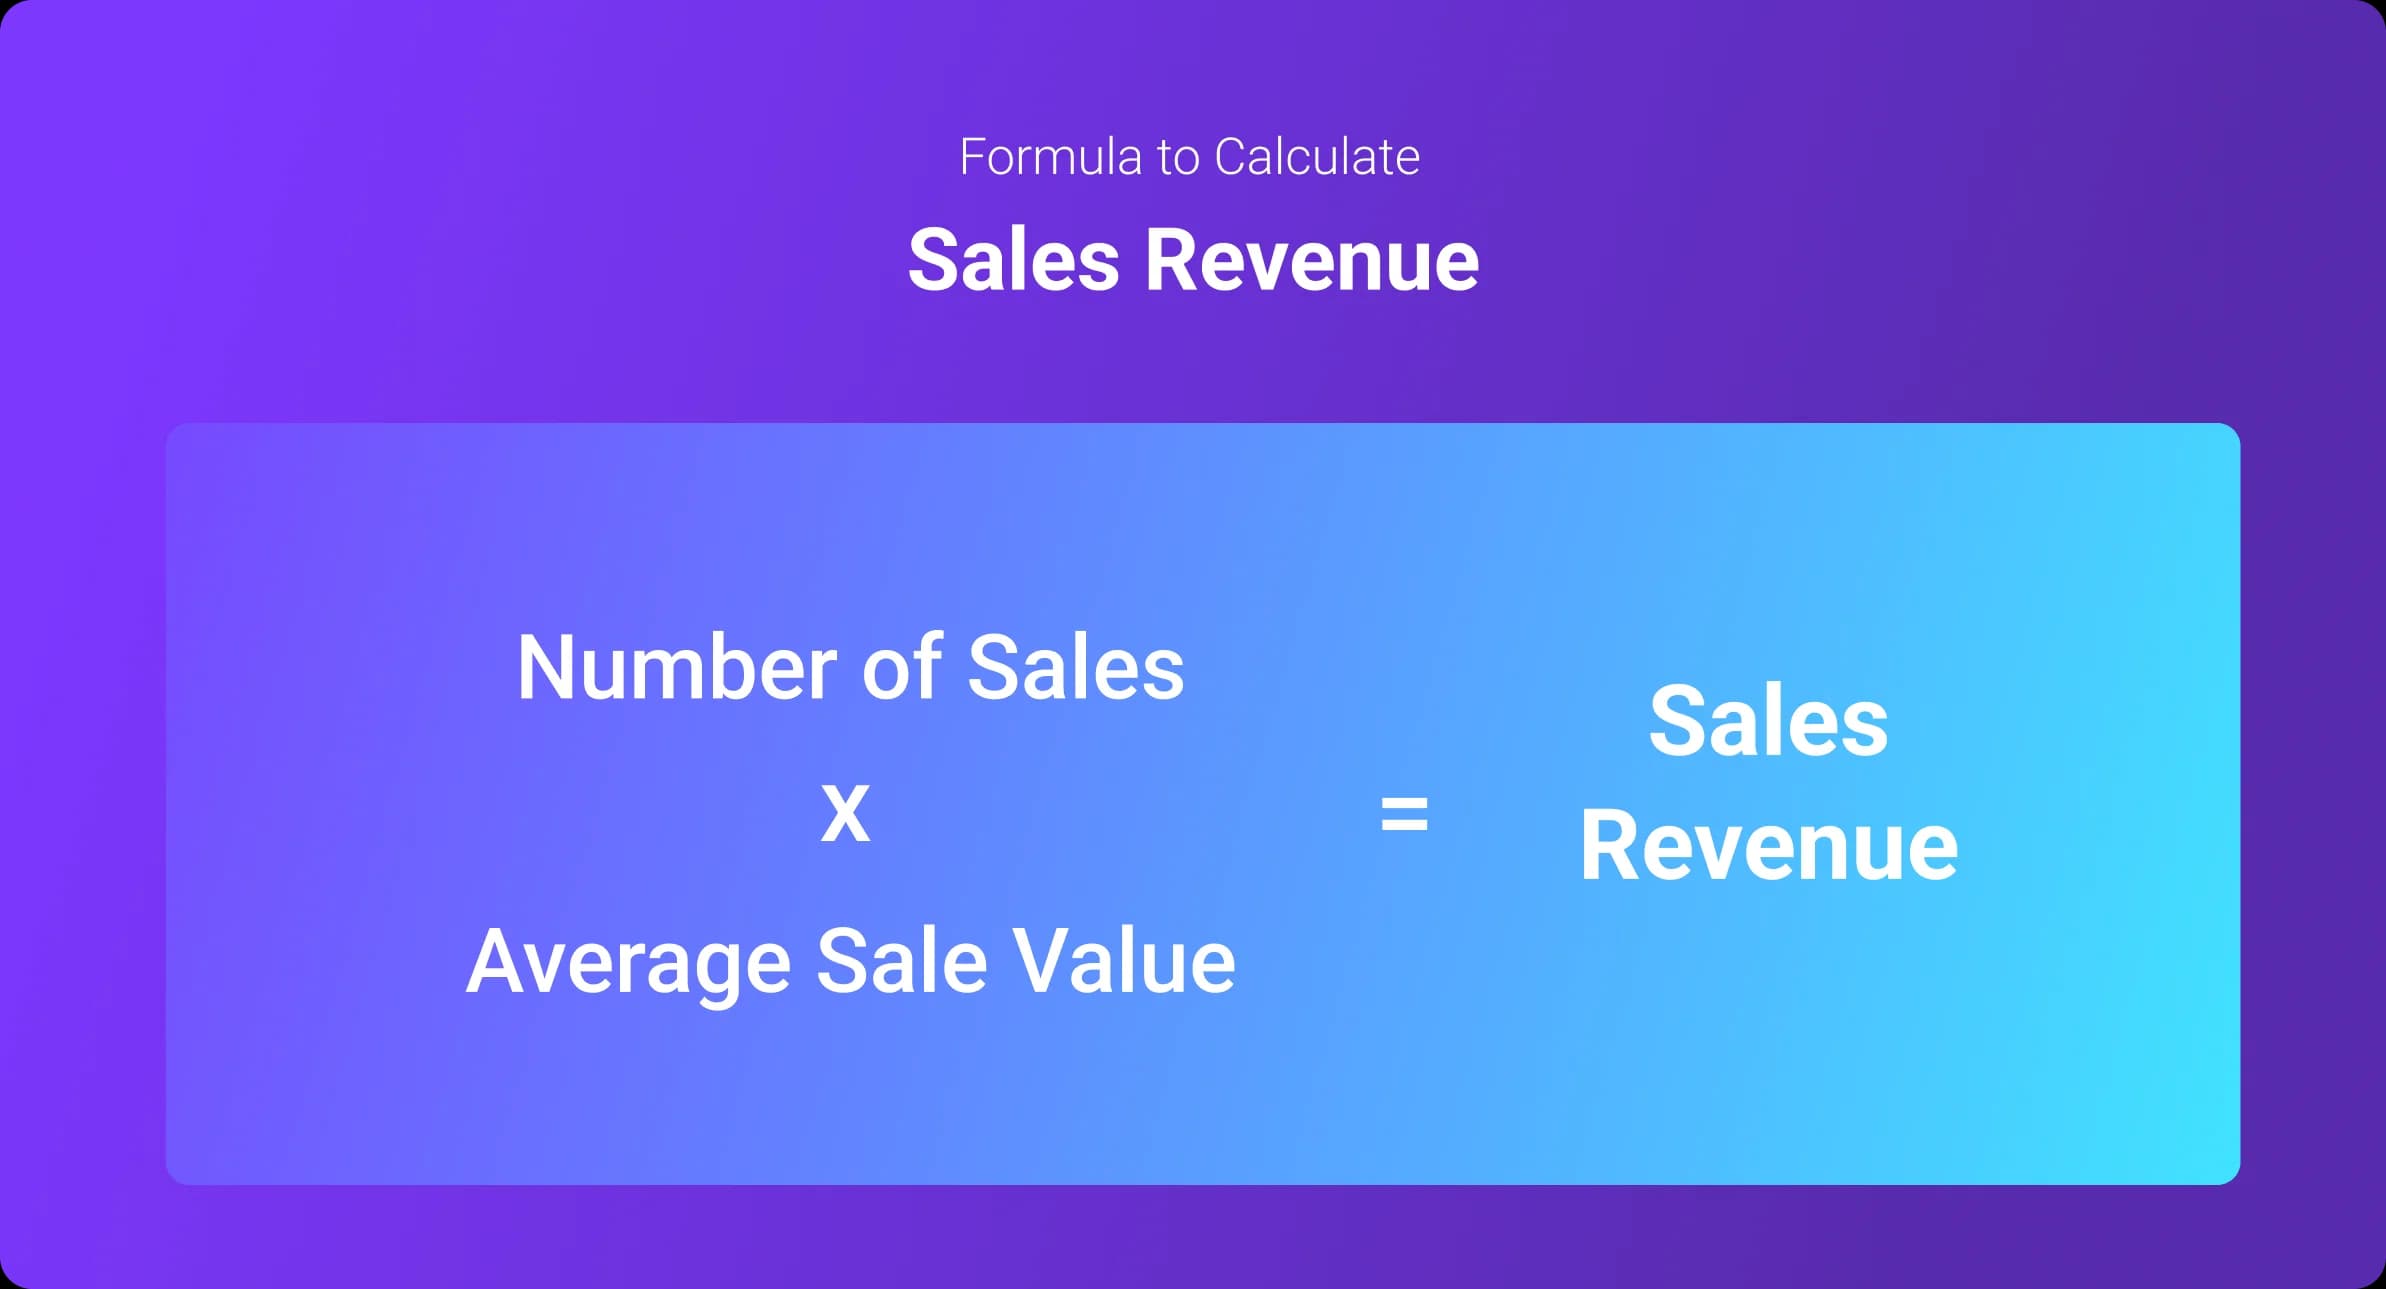
12. Sales Revenue
Definition: Sales revenue is a straightforward KPI that looks at the raw revenue from sales over a given period.
Why it matters: Sales revenue is distinct from turnover. For many companies, sales revenue alone makes up total turnover, but this is not always the case. Where other sources, like investment returns, asset sales, subsidies and so on, contribute to turnover, it’s important to differentiate. Month-on-month or year-on-year sales revenue is a useful KPI for measuring long-term sustainable growth.
Formula: Sales revenue = Number of sales x Average sale value
Strategies to Set B2B Sales KPIs for Success
Now we’ve covered the KPIs, let’s look at how to pick the perfect mix to generate new leads and fill your sales pipeline so it’s overflowing with B2B goodness.
1. Select the Right KPIs
Align with business goals. Top-tier sales KPIs should align with executive goals which then “cascade” down your organization in the form of more specific KPIs. For example, you may decide on a high-level company goal to double sales revenue. Sales managers may then use pipeline velocity as the KPI to measure movement towards this goal and individual sales reps may be tracked against outreach activity KPIs.
Analyze historical data. Analyzing historical data helps you create forecasts that can act as the basis of realistic goals and relevant KPIs. Historical data can also highlight missed opportunities for immediate results.
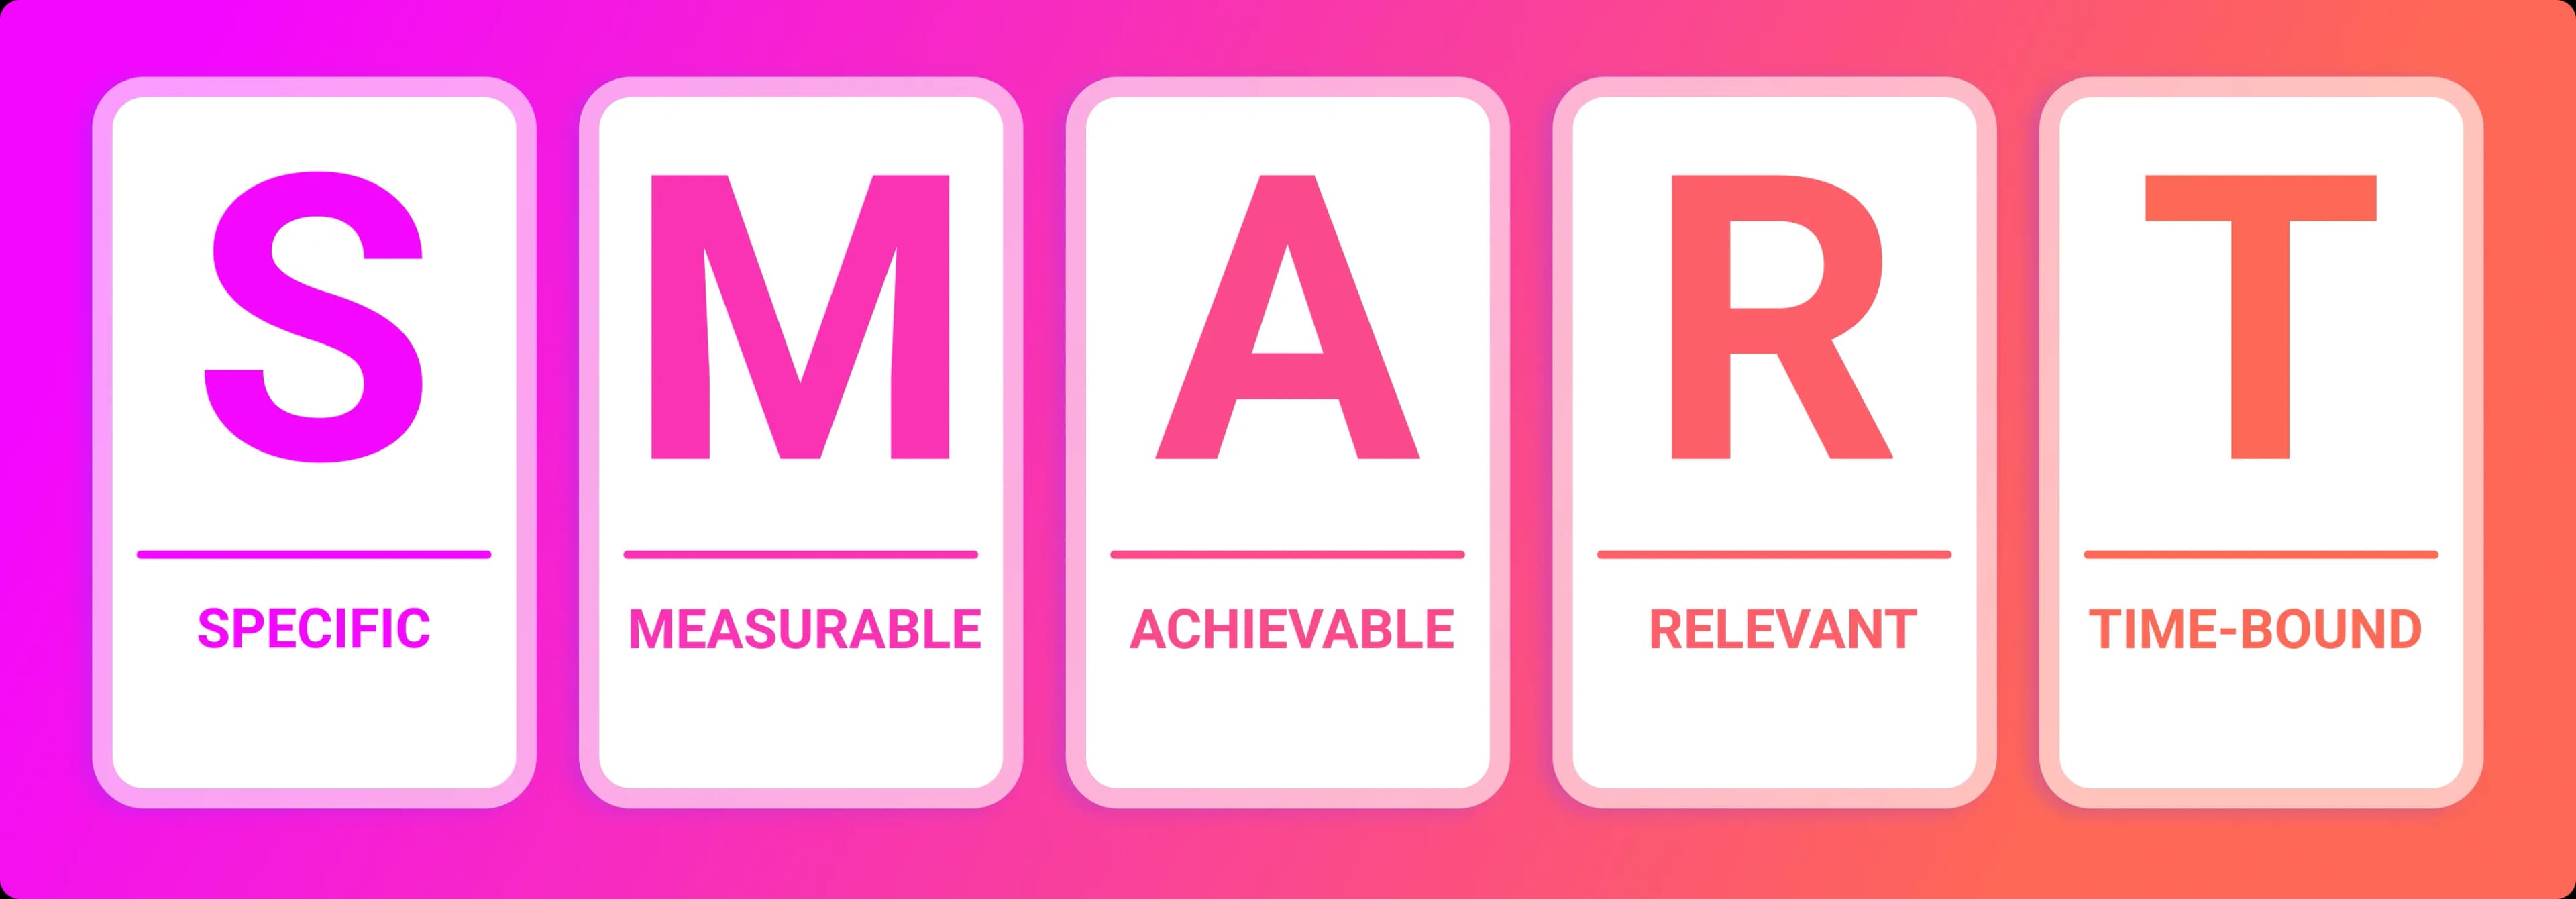
Prioritize actionable metrics. Use the SMART framework to pick KPIs and sales metrics that are Specific, Measurable, Achievable, Relevant, and Time-Bound.
Benchmark against industry standards. Industry standards are widely available, with reputable sources like Gartner, McKinsey, and Forresster often publishing industry-specific benchmarks. Ultimately, your in-house data should be your main guide, but third-party insights have their place.
Consult stakeholders. Involve all decision-makers across your organization to ensure alignment with high-level KPIs. Consider stakeholder mapping to ensure alignment with company-wide goals and specific metrics.
2. Keep it Simple, Clear, and Measurable
Choose KPIs that are relevant to different stages of your sales funnel and well-suited to your existing sales processes. Focus on a core set of sales KPIs that are likely to provide the most valuable insights and help you leverage the most prominent growth opportunities.
Wherever possible, use automation tools to streamline the collection and analysis of data so that you can measure KPIs in real time in a way that is clear and coherent to the whole sales team.
3. Track Progress Regularly and Adjust
KPIs are dynamic, fluid metrics. Track progress and make adjustments at both the tactical and strategic level as needed. This ensures your chosen KPIs remain relevant and aligned with broad business goals and that team performance stays at an optimal level.
Here are some ideas for adjusting your approach:
Refine lower-tier metrics
Update performance benchmarks
Explore ways to improve data quality
Add greater detail to reporting
Explore possible automations
Gather qualitative feedback
Adjust timeframes based on sales performance
Test and integrate new tools
Realignment incentives where appropriate
In addition, it’s important to ensure that your whole team is involved in the brainstorming process, as they will often have insights into both the best sales opportunities and where sales strategies are experiencing issues and bottlenecks.
4. Embrace New Technology
Stay up-to-date on new data analytics tools and other software to assist with tracking B2B sales KPIs. One of the most straightforward ways of optimizing your team’s sales performance is by using AI-driven automation tools, many of which sync with your main sales CRM.
Boost your sales with Artisan's data-driven outreach optimization. Our platform analyzes response rates across campaigns, refining your strategy for maximum conversion. Book a demo to discover how Artisan can help you exceed targets.
Wrapping It Up: KPIs as Keys to Growth
KPIs are fundamental to your whole business strategy. Pick the wrong ones, and you could be committing to months and even years of subpar growth and internal misalignment.
However, if you can identify KPIs that fit the broader vision of your company—whether that’s fast growth, a hyper-loyal fanbase, or a dominant presence on your primary sales channels—you’re priming your company for success.
Even better, when your chosen KPIs suit the unique strengths of your sales reps, they’re near-guaranteed to boost team performance and drive morale.
Add a layer of automation and AI-driven productivity by taking advantage of the array of powerful tools now at your disposal, and you’ll be hitting those targets faster than you can say “sales."